Demo: fMRI Region-Of-Interest (ROI) analyses
The data used here is available from http://cosmomvpa.org/datadb.zip
It is based on the following work: * Connolly et al (2012), Representation of biological classes in the human brain. Journal of Neuroscience, doi 10.1523/JNEUROSCI.5547-11.2012
Six categories (monkey, lemur, mallard, warbler, ladybug, lunamoth) during ten runs in an fMRI study. Using the General Linear Model response were estimated for each category in each run, resulting in 6*10=60 t-values.
- For CoSMoMVPA's copyright information and license terms, #
- see the COPYING file distributed with CoSMoMVPA. #
Contents
Set data paths
The function cosmo_config() returns a struct containing paths to tutorial data. (Alternatively the paths can be set manually without using cosmo_config.)
config = cosmo_config();
study_path = fullfile(config.tutorial_data_path, 'ak6');
output_path = config.output_data_path;

readme_fn = fullfile(study_path, 'README');
cosmo_type(readme_fn);

% reset citation list
cosmo_check_external('-tic');
   #    #    #        #####     ######
  # #   #   #        #     #    #     #   ##   #####   ##
 #   #  #  #         #          #     #  #  #    #    #  #
#     # ###    ##### ######     #     # #    #   #   #    #
####### #  #         #     #    #     # ######   #   ######
#     # #   #        #     #    #     # #    #   #   #    #
#     # #    #        #####     ######  #    #   #   #    #

Overview
--------
fMRI responses to viewing images of six species in the animal kingdom,
used in Connollly et al. 2012.

Contents
--------

- s0[1-8]/                  This directory contains fMRI data from 8 of the 12
                            participants studied in the experiment reported in
                            Connolly et al. 2012 (Code-named 'AK6' for animal
                            kingdom, 6-species). Each subject's subdirectory
                            contains the following data:
   - glm_T_stats_perrun.nii A 60-volume file of EPI-data preprocessed using
                            AFNI up to and including fitting a general linear
                            model using 3dDeconvolve. Each volume contains the
                            t-statistics for the estimated response to a one
                            of the 6 stimulus categories. These estimates were
                            calculated independently for each of the 10 runs
                            in the experiment.
   - glm_T_stats_even.nii   Data derived from glm_T_stats_perrun.nii.
   - glm_T_stats_odd.nii    Each is a 6-volume file with the T-values averaged
                            across even and odd runs for each category.
   - brain.nii              Skull-stripped T1-weighted anatomical brain image.
   - brain_mask.nii         Whole-brain mask in EPI-space/resolution.
   - vt_mask.nii            Bilateral ventral temporal cortex mask similar to
                            that used in Connolly et al. 2012.
   - ev_mask.nii            Bilateral early visual cortex mask.
- models
   - behav_sim.mat          Matlab file with behavioural similarity ratings.
   - v1_model.mat           Matlab file with similarity values based on
                            low-level visual properties of the stimuli.

Methods
-------
The stimulus-specific volumes in the stats T-stats file are in the order

    monkey, lemur, mallard (duck), warbler, ladybug, lunamoth

for each of the ten runs.

Reference
---------
When using this dataset for any publication please cite:

Connolly, A. C. , Guntupalli, J. S. , Gors, J. , Hanke, M. , Halchenko, Y. O.,
Wu, Y. , Abdi, H. and Haxby, J. V. (2012). Representation of biological classes
in the human brain. Journal of Neuroscience, 32, 2608-2618.
[PDF] DOI: 10.1523/JNEUROSCI.5547-11.2012,

Contact
-------
Andrew C. Connolly <andrew.c.connolly |at| dartmouth.edu>
Example 1: split-half correlation measure (Haxby 2001-style)
%%%%%%%%%%%%%%%%%%%%%%%%%%%%%%%%%%%%%%%%%%%%%%%%%%%%%%%%%%%%%%%
subject_id = 's01';
mask_label = 'ev_mask';
data_path = fullfile(study_path, subject_id); % data from subject s01

% Define data locations and load data from even and odd runs
mask_fn = fullfile(data_path, [mask_label '.nii']); % whole brain

data_odd_fn = fullfile(data_path, 'glm_T_stats_odd.nii');
ds_odd = cosmo_fmri_dataset(data_odd_fn, 'mask', mask_fn, ...
                            'targets', 1:6, 'chunks', 1);

data_even_fn = fullfile(data_path, 'glm_T_stats_even.nii');
ds_even = cosmo_fmri_dataset(data_even_fn, 'mask', mask_fn, ...
                             'targets', 1:6, 'chunks', 2);

% Combine even and odd runs
ds_odd_even = cosmo_stack({ds_odd, ds_even});

% remove constant features
ds_odd_even = cosmo_remove_useless_data(ds_odd_even);

% print dataset
fprintf('Dataset input:\n');
cosmo_disp(ds_odd_even);

% compute correlations
ds_corr = cosmo_correlation_measure(ds_odd_even);

% show result
fprintf(['Average correlation difference between matching and '...
         'non-matching categories in %s for %s is %.3f\n'], ...
        mask_label, subject_id, ds_corr.samples);
Dataset input:
.samples
  [   1.77      3.61      4.28  ...  0.0628     0.708      1.02
       1.3      3.05       3.9  ...   0.159     0.949      1.76
      2.09      1.71      3.61  ...   0.908     0.468      1.34
       :          :         :           :         :         :
    0.0247      1.82      2.18  ...   0.241     0.906      1.77
      1.64      2.12      3.97  ...   -1.32     0.985     0.221
      2.08      2.72      3.18  ...    -1.4     0.984     0.379 ]@12x298
.sa
  .chunks
    [ 1
      1
      1
      :
      2
      2
      2 ]@12x1
  .targets
    [ 1
      2
      3
      :
      4
      5
      6 ]@12x1
.fa
  .i
    [ 44        42        43  ...  43        40        41 ]@1x298
  .j
    [ 15        15        15  ...  16        19        19 ]@1x298
  .k
    [ 3         4         4  ...  13        13        13 ]@1x298
.a
  .fdim
    .labels
      { 'i'
        'j'
        'k' }
    .values
      { [ 1         2         3  ...  78        79        80 ]@1x80
        [ 1         2         3  ...  78        79        80 ]@1x80
        [ 1         2         3  ...  41        42        43 ]@1x43 }
  .vol
    .mat
      [ 3         0         0      -122
        0         3         0      -114
        0         0         3     -11.1
        0         0         0         1 ]
    .xform
      'scanner_anat'
    .dim
      [ 80        80        43 ]
Average correlation difference between matching and non-matching categories in ev_mask for s01 is 0.467
Example 2: split-half correlation measure with group analysis
%%%%%%%%%%%%%%%%%%%%%%%%%%%%%%%%%%%%%%%%%%%%%%%%%%%%%%%%%%%%%%%

subject_ids = {'s01', 's02', 's03', 's04', 's05', 's06', 's07', 's08'};
nsubjects = numel(subject_ids);

mask_label = 'vt_mask';

ds_corrs = cell(nsubjects, 1); % allocate space for output
for subject_num = 1:nsubjects
    subject_id = subject_ids{subject_num};

    % Code from here is pretty much identical to that above >>>

    % set path for this subject
    data_path = fullfile(study_path, subject_id);

    % Define data locations and load data from even and odd runs
    mask_fn = fullfile(data_path, [mask_label '.nii']); % whole brain

    data_odd_fn = fullfile(data_path, 'glm_T_stats_odd.nii');
    ds_odd = cosmo_fmri_dataset(data_odd_fn, 'mask', mask_fn, ...
                                'targets', 1:6, 'chunks', 1);

    data_even_fn = fullfile(data_path, 'glm_T_stats_even.nii');
    ds_even = cosmo_fmri_dataset(data_even_fn, 'mask', mask_fn, ...
                                 'targets', 1:6, 'chunks', 2);

    % Combine even and odd runs
    ds_odd_even = cosmo_stack({ds_odd, ds_even});

    % remove constant features
    ds_odd_even = cosmo_remove_useless_data(ds_odd_even);

    ds_corr = cosmo_correlation_measure(ds_odd_even);

    % <<< identical up to here

    % set targets and chunks for the output, so that cosmo_stat can be used
    % below
    ds_corr.sa.targets = 1;
    ds_corr.sa.chunks = subject_num;

    ds_corrs{subject_num} = ds_corr;
end

% combine the data from all subjects
ds_all = cosmo_stack(ds_corrs);
samples = ds_all.samples; % get the correlations for all subjects

% run one-sample t-test again zero

% Using cosmo_stats
ds_t = cosmo_stat(ds_all, 't');     % t-test against zero
ds_p = cosmo_stat(ds_all, 't', 'p'); % convert to p-value

fprintf(['correlation difference in %s at group level: '...
         '%.3f +/- %.3f, %s=%.3f, p=%.5f (using cosmo_stat)\n'], ...
        mask_label, mean(samples), std(samples), ...
        ds_t.sa.stats{1}, ds_t.samples, ds_p.samples);

% Using matlab's stat toolbox (if present)
if cosmo_check_external('@stats', false)
    [h, p, ci, stats] = ttest(samples);
    fprintf(['Correlation difference in %s at group level: '...
             '%.3f +/- %.3f, t_%d=%.3f, p=%.5f (using matlab stats '...
             'toolbox)\n'], ...
            mask_label, mean(samples), std(samples), stats.df, stats.tstat, p);
else
    fprintf('Matlab stats toolbox not found\n');
end
correlation difference in vt_mask at group level: 0.399 +/- 0.165, Ttest(7)=6.846, p=0.00024 (using cosmo_stat)
Correlation difference in vt_mask at group level: 0.399 +/- 0.165, t_7=6.846, p=0.00024 (using matlab stats toolbox)
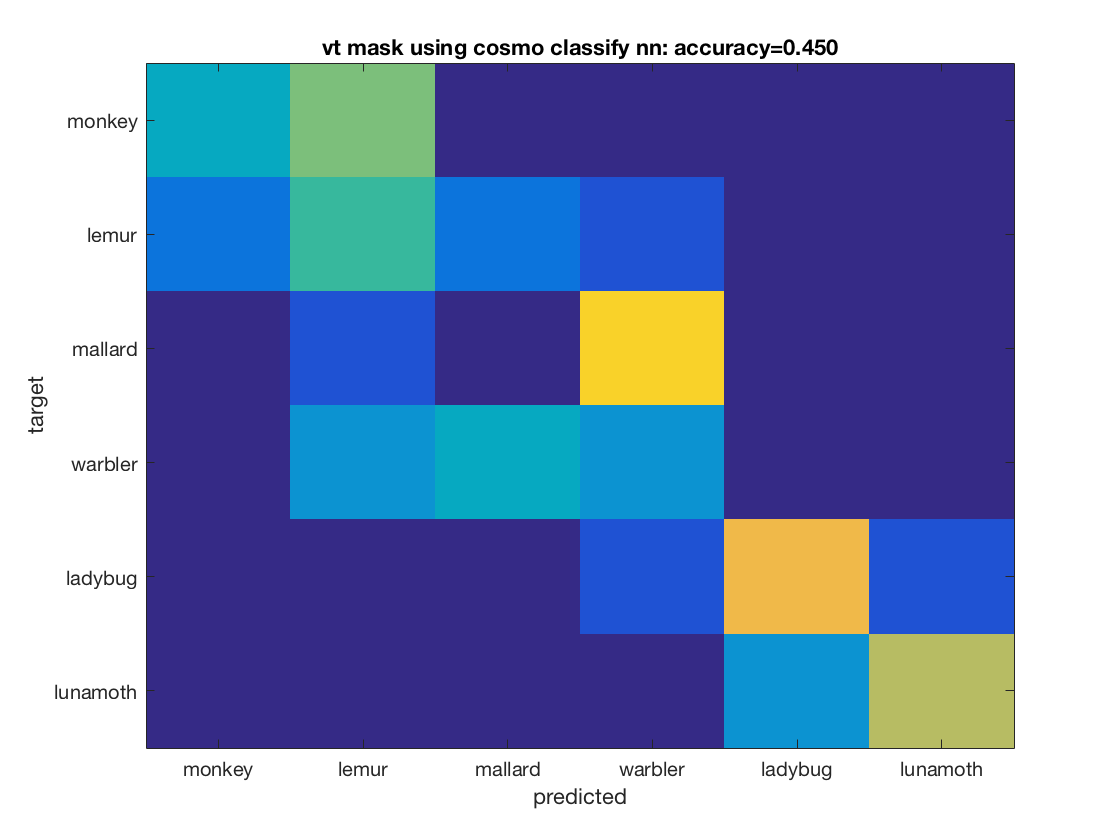
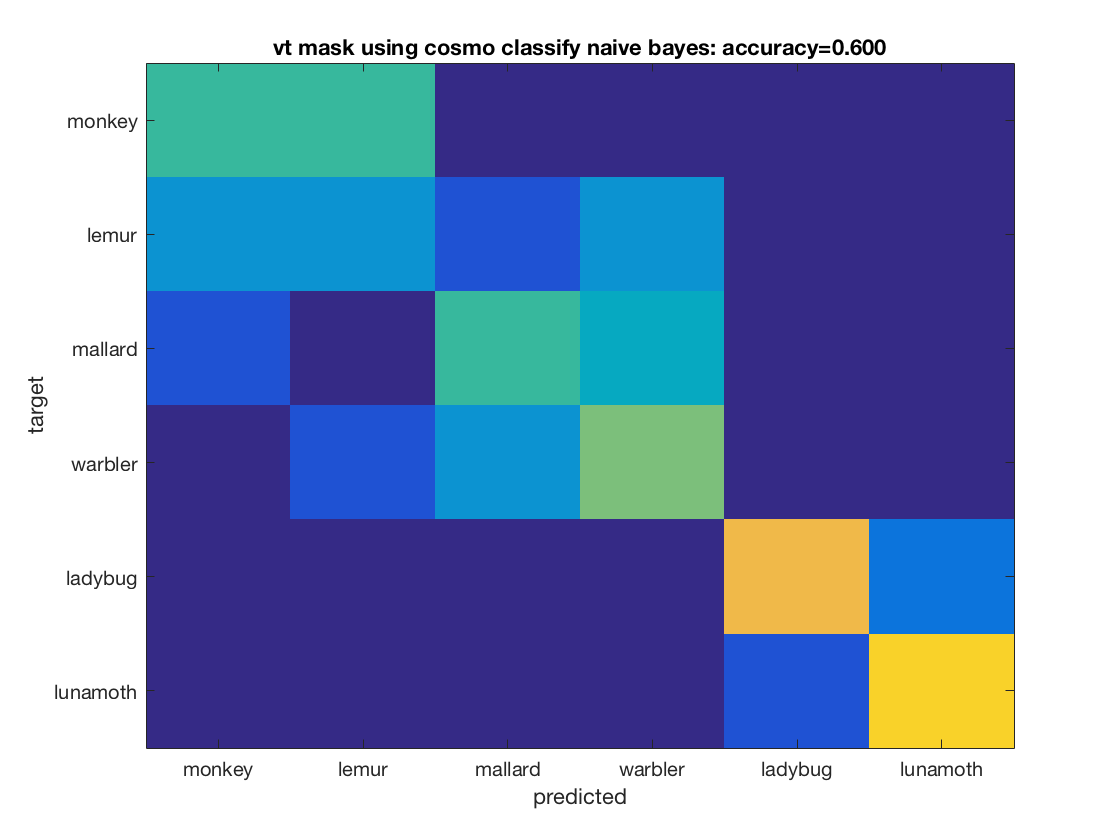
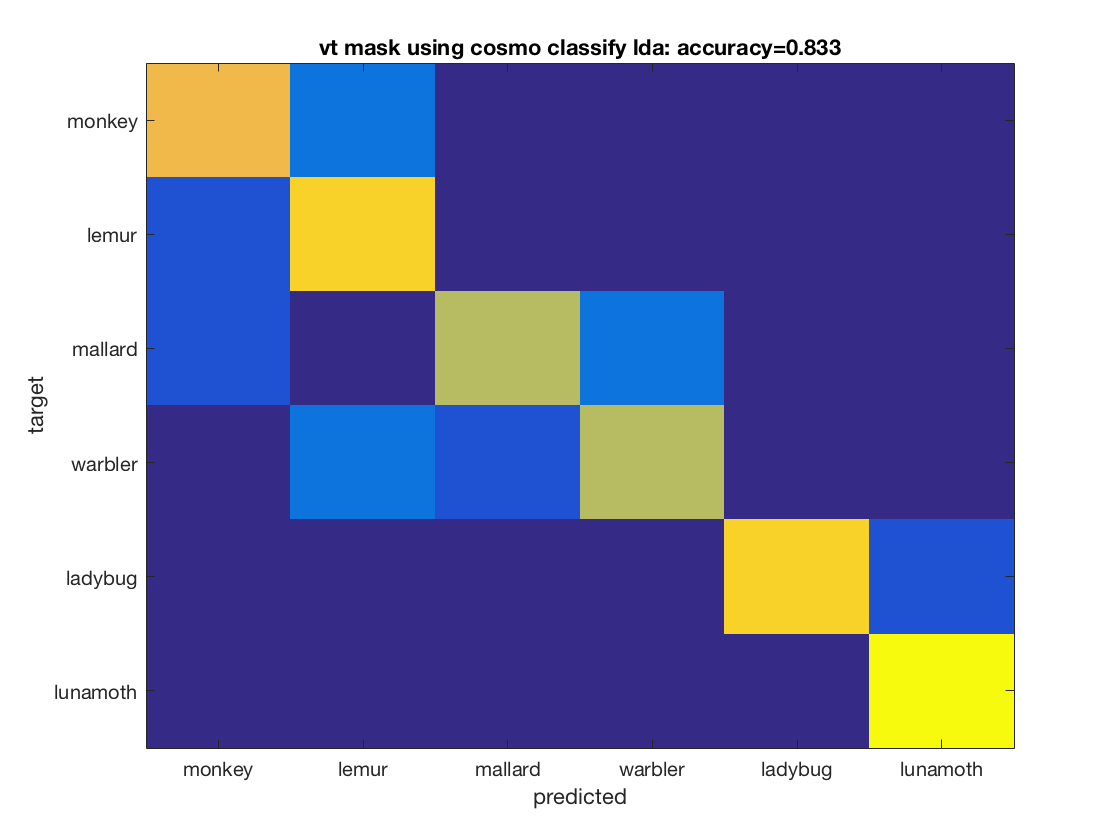
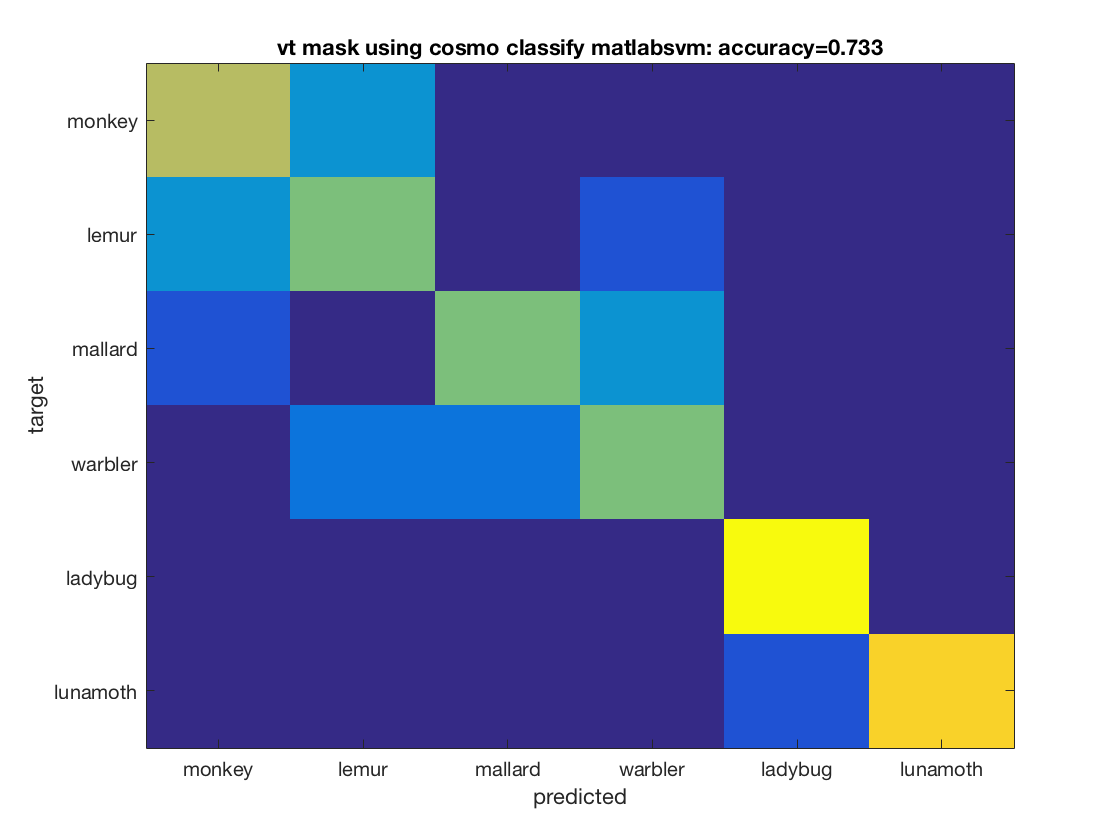
Example 3: comparison of four classifiers in two regions of interest
config = cosmo_config();
data_path = fullfile(config.tutorial_data_path, 'ak6', 's01');
data_fn = fullfile(data_path, 'glm_T_stats_perrun.nii');

% Define classifiers and mask labels
classifiers = {@cosmo_classify_nn, ...
               @cosmo_classify_naive_bayes, ...
               @cosmo_classify_lda};

% Use svm classifiers, if present
svm_name2func = struct();
svm_name2func.matlabsvm = @cosmo_classify_matlabsvm;
svm_name2func.libsvm = @cosmo_classify_libsvm;
svm_name2func.svm = @cosmo_classify_svm;
svm_names = fieldnames(svm_name2func);
for k = 1:numel(svm_names)
    svm_name = svm_names{k};
    if cosmo_check_external(svm_name, false)
        classifiers{end + 1} = svm_name2func.(svm_name);
    else
        warning('Classifier %s skipped because not available', svm_name);
    end
end

mask_labels = {'vt_mask', 'ev_mask'};

%
nclassifiers = numel(classifiers);
nmasks = numel(mask_labels);

labels = {'monkey', 'lemur', 'mallard', 'warbler', 'ladybug', 'lunamoth'};
nlabels = numel(labels);

% little helper function to replace underscores by spaces
underscore2space = @(x) strrep(x, '_', ' ');

for j = 1:nmasks
    mask_label = mask_labels{j};
    mask_fn = fullfile(data_path, [mask_label '.nii']);
    ds = cosmo_fmri_dataset(data_fn, 'mask', mask_fn, ...
                            'targets', repmat(1:6, 1, 10), ...
                            'chunks', floor(((1:60) - 1) / 6) + 1);

    % remove constant features
    ds = cosmo_remove_useless_data(ds);

    % print dataset
    fprintf('Dataset input:\n');
    cosmo_disp(ds);

    % Define partitions
    partitions = cosmo_nfold_partitioner(ds);

    % print dataset
    fprintf('Partitions:\n');
    cosmo_disp(partitions);

    % show result for each classifier
    for k = 1:nclassifiers
        classifier = classifiers{k};

        % get predictions for each fold
        [pred, accuracy] = cosmo_crossvalidate(ds, classifier, partitions);

        % get confusion matrix for each fold
        confusion_matrix_folds = cosmo_confusion_matrix(ds.sa.targets, pred);

        % sum confusion for each ground-truth target and prediction,
        % resulting in an nclasses x nclasses matrix
        confusion_matrix = sum(confusion_matrix_folds, 3);
        figure;
        imagesc(confusion_matrix, [0 10]);
        cfy_label = underscore2space(func2str(classifier));
        title_ = sprintf('%s using %s: accuracy=%.3f', ...
                         underscore2space(mask_label), cfy_label, accuracy);
        title(title_);
        set(gca, 'XTick', 1:nlabels, 'XTickLabel', labels);
        set(gca, 'YTick', 1:nlabels, 'YTickLabel', labels);
        ylabel('target');
        xlabel('predicted');
    end
end
Warning: Classifier matlabsvm skipped because not available
Warning: Classifier libsvm skipped because not available
Warning: Classifier svm skipped because not available
Dataset input:
.a
  .vol
    .mat
      [ -3         0         0       121
         0         3         0      -114
         0         0         3     -11.1
         0         0         0         1 ]
    .xform
      'scanner_anat'
    .dim
      [ 80        80        43 ]
  .fdim
    .labels
      { 'i'
        'j'
        'k' }
    .values
      { [ 1         2         3  ...  78        79        80 ]@1x80
        [ 1         2         3  ...  78        79        80 ]@1x80
        [ 1         2         3  ...  41        42        43 ]@1x43 }
.sa
  .targets
    [ 1
      2
      3
      :
      4
      5
      6 ]@60x1
  .chunks
    [  1
       1
       1
       :
      10
      10
      10 ]@60x1
.samples
  [ 2.73      2.62      2.19  ...  0.669      1.78      2.42
    2.51      2.99      3.25  ...   1.06      1.61     0.943
     1.3     0.646     0.591  ...   1.51      1.75      3.08
      :        :         :           :          :        :
     1.5       1.6      2.07  ...  0.491       1.1      1.78
    2.56      1.28      2.11  ...  0.687      1.88      2.72
       1      0.96      1.62  ...   2.86      4.04      4.28 ]@60x384
.fa
  .i
    [ 32        33        34  ...  28        29        29 ]@1x384
  .j
    [ 24        24        24  ...  25        25        26 ]@1x384
  .k
    [ 3         3         3  ...  9         9         9 ]@1x384
Partitions:
.train_indices
  { [  7         [  1         [  1        ... [  1         [  1         [  1
       8            2            2               2            2            2
       9            3            3               3            3            3
       :            :            :               :            :            :
      58           58           58              58           58           52
      59           59           59              59           59           53
      60 ]@54x1    60 ]@54x1    60 ]@54x1       60 ]@54x1    60 ]@54x1    54 ]@54x1   }@1x10
.test_indices
  { [ 1    [  7    [ 13   ... [ 43    [ 49    [ 55
      2       8      14         44      50      56
      3       9      15         45      51      57
      4      10      16         46      52      58
      5      11      17         47      53      59
      6 ]    12 ]    18 ]       48 ]    54 ]    60 ]   }@1x10
Dataset input:
.a
  .vol
    .mat
      [ -3         0         0       121
         0         3         0      -114
         0         0         3     -11.1
         0         0         0         1 ]
    .xform
      'scanner_anat'
    .dim
      [ 80        80        43 ]
  .fdim
    .labels
      { 'i'
        'j'
        'k' }
    .values
      { [ 1         2         3  ...  78        79        80 ]@1x80
        [ 1         2         3  ...  78        79        80 ]@1x80
        [ 1         2         3  ...  41        42        43 ]@1x43 }
.sa
  .targets
    [ 1
      2
      3
      :
      4
      5
      6 ]@60x1
  .chunks
    [  1
       1
       1
       :
      10
      10
      10 ]@60x1
.samples
  [ 0.568      4.21      4.11  ...    3.18      2.37     0.473
     1.45      4.33      4.86  ...    2.43     0.544     0.846
     2.23      1.97      2.76  ...     1.5    -0.335     0.485
      :          :        :            :        :          :
    -1.35      1.35    -0.116  ...  -0.217     0.628     0.756
     1.52      2.69      3.35  ...   0.898   -0.0235     0.102
    0.457      1.23      2.67  ...    -0.5    -0.215      1.67 ]@60x298
.fa
  .i
    [ 37        37        38  ...  40        40        41 ]@1x298
  .j
    [ 15        15        15  ...  16        19        19 ]@1x298
  .k
    [ 3         4         4  ...  13        13        13 ]@1x298
Partitions:
.train_indices
  { [  7         [  1         [  1        ... [  1         [  1         [  1
       8            2            2               2            2            2
       9            3            3               3            3            3
       :            :            :               :            :            :
      58           58           58              58           58           52
      59           59           59              59           59           53
      60 ]@54x1    60 ]@54x1    60 ]@54x1       60 ]@54x1    60 ]@54x1    54 ]@54x1   }@1x10
.test_indices
  { [ 1    [  7    [ 13   ... [ 43    [ 49    [ 55
      2       8      14         44      50      56
      3       9      15         45      51      57
      4      10      16         46      52      58
      5      11      17         47      53      59
      6 ]    12 ]    18 ]       48 ]    54 ]    60 ]   }@1x10


Show citation information
cosmo_check_external('-cite');
If you use CoSMoMVPA and/or some other toolboxes for a publication, please cite:

J. Shen. NIFTI toolbox. available online from http://www.mathworks.com/matlabcentral/fileexchange/8797-tools-for-nifti-and-analyze-image

N. N. Oosterhof, A. C. Connolly, J. V. Haxby (2016). CoSMoMVPA: multi-modal multivariate pattern analysis of neuroimaging data in Matlab / GNU Octave. Frontiers in Neuroinformatics, doi:10.3389/fninf.2016.00027.. CoSMoMVPA toolbox available online from http://cosmomvpa.org

The Mathworks, Natick, MA, United States. Matlab 24.1.0.2537033 (R2024a) (February 21, 2024). available online from http://www.mathworks.com