Contents
NIFTI basics
In this example, load a brain and visualize it in matlab
- For CoSMoMVPA's copyright information and license terms, #
- see the COPYING file distributed with CoSMoMVPA. #
% Set the path.
config = cosmo_config();
data_path = fullfile(config.tutorial_data_path, 'ak6', 's01');

% Set filename
fn = fullfile(data_path, 'brain.nii');

% Load with nifti
ni = load_nii(fn);
Show the contents of the nifti header
cosmo_disp(ni.hdr);

% print the dimensions
size(ni.img);

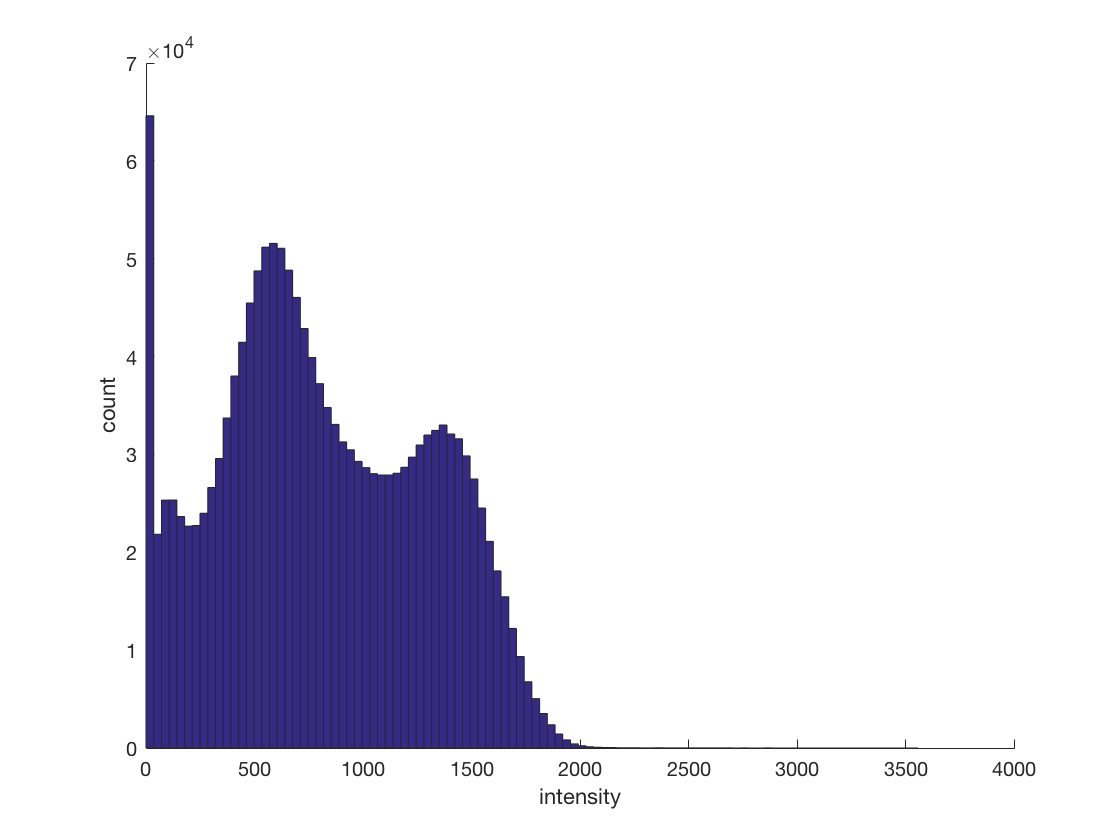
% plot a histogram of the intensities (use only values greater than zero)
% change the number of bins
% >@@>
figure;
set(gcf, 'name', 'Intensity Histogram');
hist(ni.img(ni.img(:) > 0), 100);
xlabel('intensity');
ylabel('count');
box off;
% <@@<
.hk
  .sizeof_hdr
    [ 348 ]
  .data_type
    ''
  .db_name
    ''
  .extents
    [ 0 ]
  .session_error
    [ 0 ]
  .regular
    'r'
  .dim_info
    [ 0 ]
.dime
  .dim
    [ 3       160       256  ...  1         1         1 ]@1x8
  .intent_p1
    [ 0 ]
  .intent_p2
    [ 0 ]
  .intent_p3
    [ 0 ]
  .intent_code
    [ 0 ]
  .datatype
    [ 16 ]
  .bitpix
    [ 32 ]
  .slice_start
    [ 0 ]
  .pixdim
    [ 1         1     0.938  ...  0         0         0 ]@1x8
  .vox_offset
    [ 4.13e+03 ]
  .scl_slope
    [ 0 ]
  .scl_inter
    [ 0 ]
  .slice_end
    [ 0 ]
  .slice_code
    [ 0 ]
  .xyzt_units
    [ 2 ]
  .cal_max
    [ 0 ]
  .cal_min
    [ 0 ]
  .slice_duration
    [ 0 ]
  .toffset
    [ 0 ]
  .glmax
    [ 3.56e+03 ]
  .glmin
    [ 0 ]
.hist
  .descrip
    ''
  .aux_file
    ''
  .qform_code
    [ 0 ]
  .sform_code
    [ 0 ]
  .quatern_b
    [ 0.5 ]
  .quatern_c
    [ -0.5 ]
  .quatern_d
    [ -0.5 ]
  .qoffset_x
    [ -83.9 ]
  .qoffset_y
    [ 123 ]
  .qoffset_z
    [ -64.9 ]
  .srow_x
    [ 0         0         1     -83.9 ]
  .srow_y
    [ -0.938         0         0       123 ]
  .srow_z
    [ 0     0.938         0     -64.9 ]
  .intent_name
    ''
  .magic
    'n+1'
  .originator
    [ 84.9       125      70.2        63         0 ]
  .rot_orient
    [ 3         1         2 ]
  .flip_orient
    [ 0         3         0 ]

Plot slices
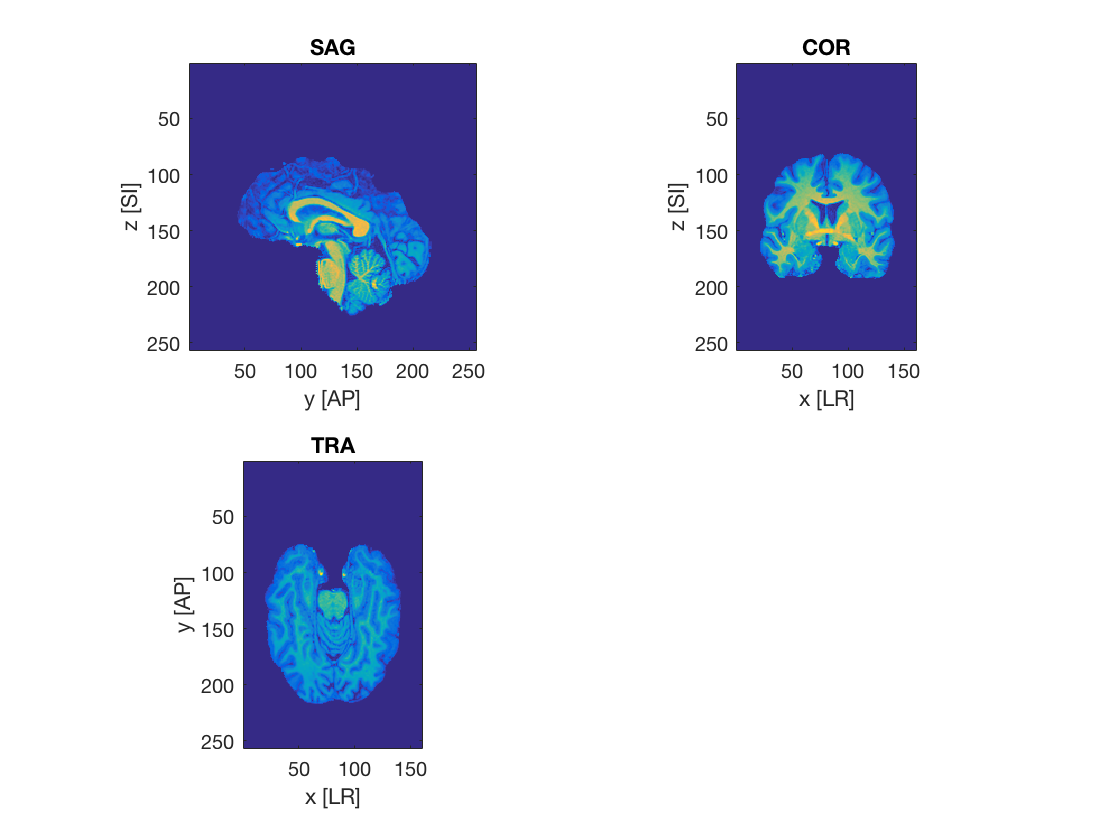
plot a sagittal, coronal and axial slice at voxel positions (80,150,80) using squeeze and transpose ("'") where necessary. (bonus points for axis labels and proper orientations, i.e. in the sagittal view the front of the brain is on the left and the back is on the right)
ii = 80;
jj = 150;
kk = 80;
figure;
% >@@>
set(gcf, 'name', 'Canonical Views');
subplot(2, 2, 1);
% imagesc(fliplr(rot90(squeeze(ni.img(ii, :, :)))))
imagesc(squeeze(ni.img(ii, end:-1:1, end:-1:1))');
axis image;
title('SAG');
xlabel('y [AP]');
ylabel('z [SI]');

subplot(2, 2, 2);
% imagesc(fliplr(rot90(squeeze(ni.img(:, jj, :)))))
imagesc(squeeze(ni.img(:, jj, end:-1:1))');
axis image;
title('COR');
xlabel('x [LR]');
ylabel('z [SI]');

subplot(2, 2, 3);
% imagesc(fliplr(rot90(ni.img(:, :, kk))))
imagesc(squeeze(ni.img(:, end:-1:1, kk))');
axis image;
title('TRA');
xlabel('x [LR]');
ylabel('y [AP]');
% <@@<

Plot slice in all three dimensions
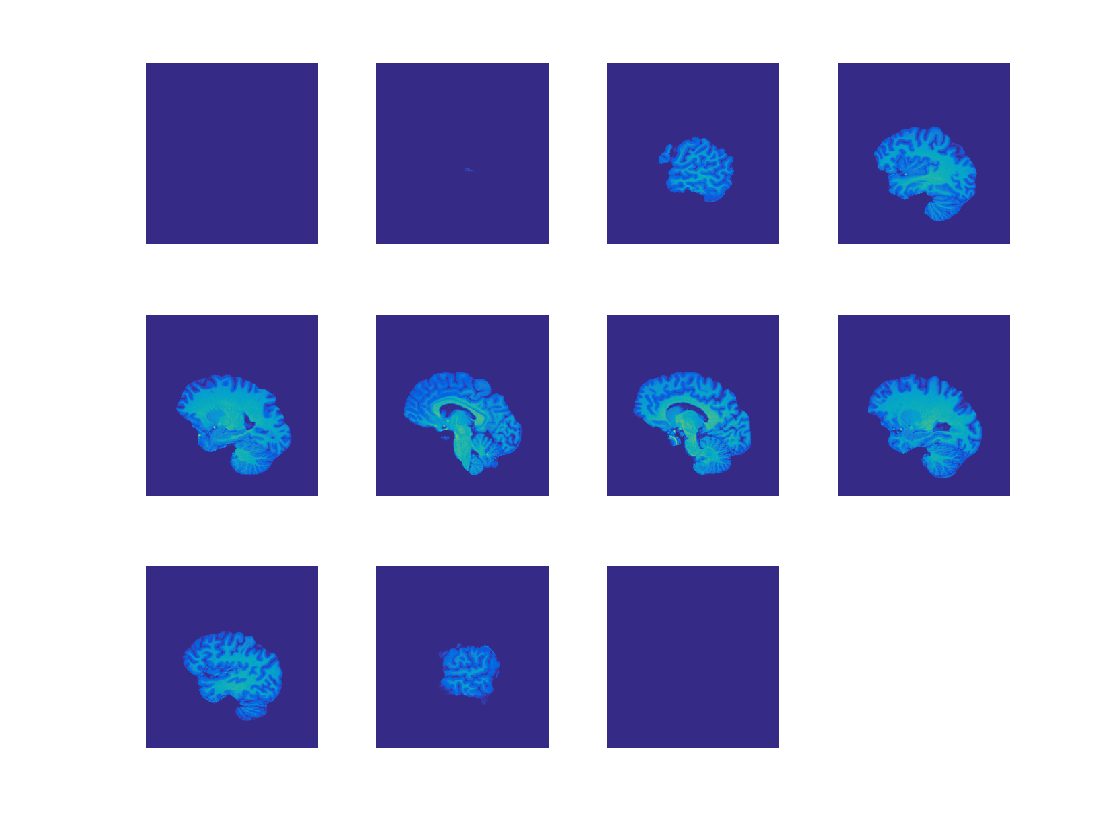
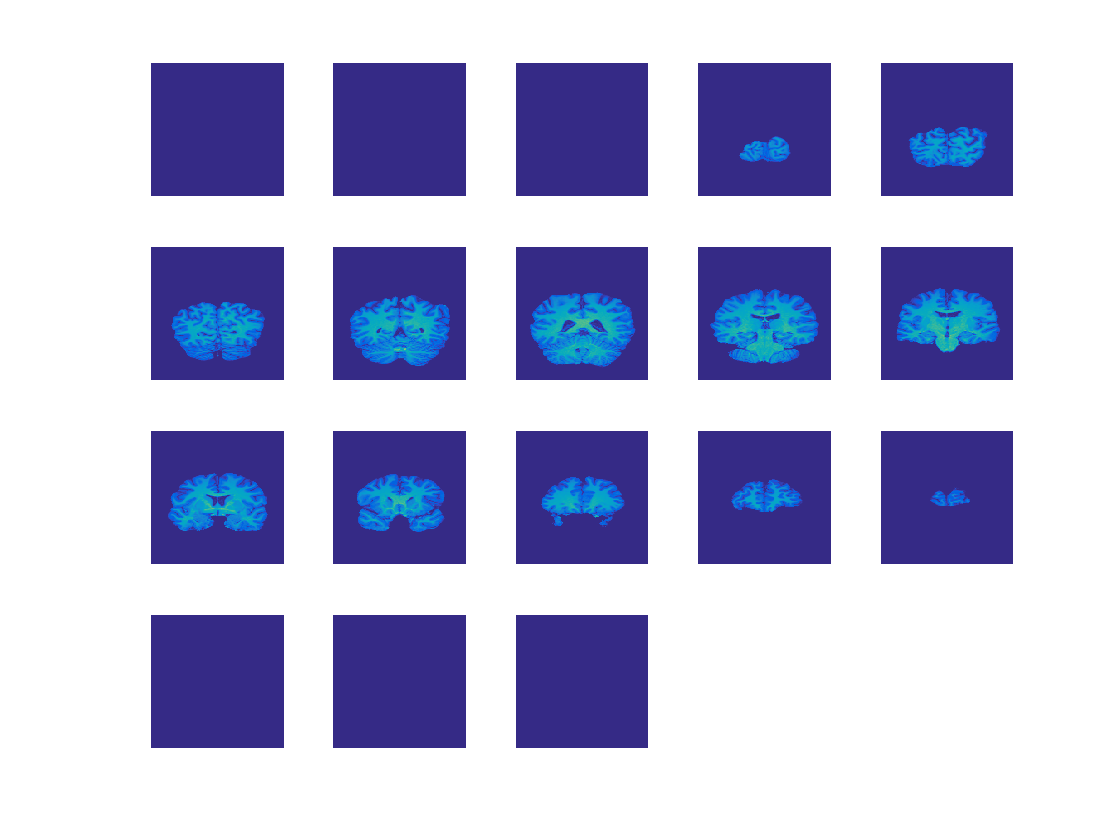
This uses the cosmo_plot_slices helper function
slice_step = 15;
strView = {'SAG', 'COR', 'TRA'};

for dim = 1:3
    figure;
    % >@@>
    cosmo_plot_slices(ni.img, dim, slice_step);
    axh = findobj(gcf, 'Type', 'axes');
    set(axh, 'visible', 'off');
    set(gcf, 'name', sprintf('Slices %s', strView{dim}));
    % <@@<
end


