Introduction
Parts
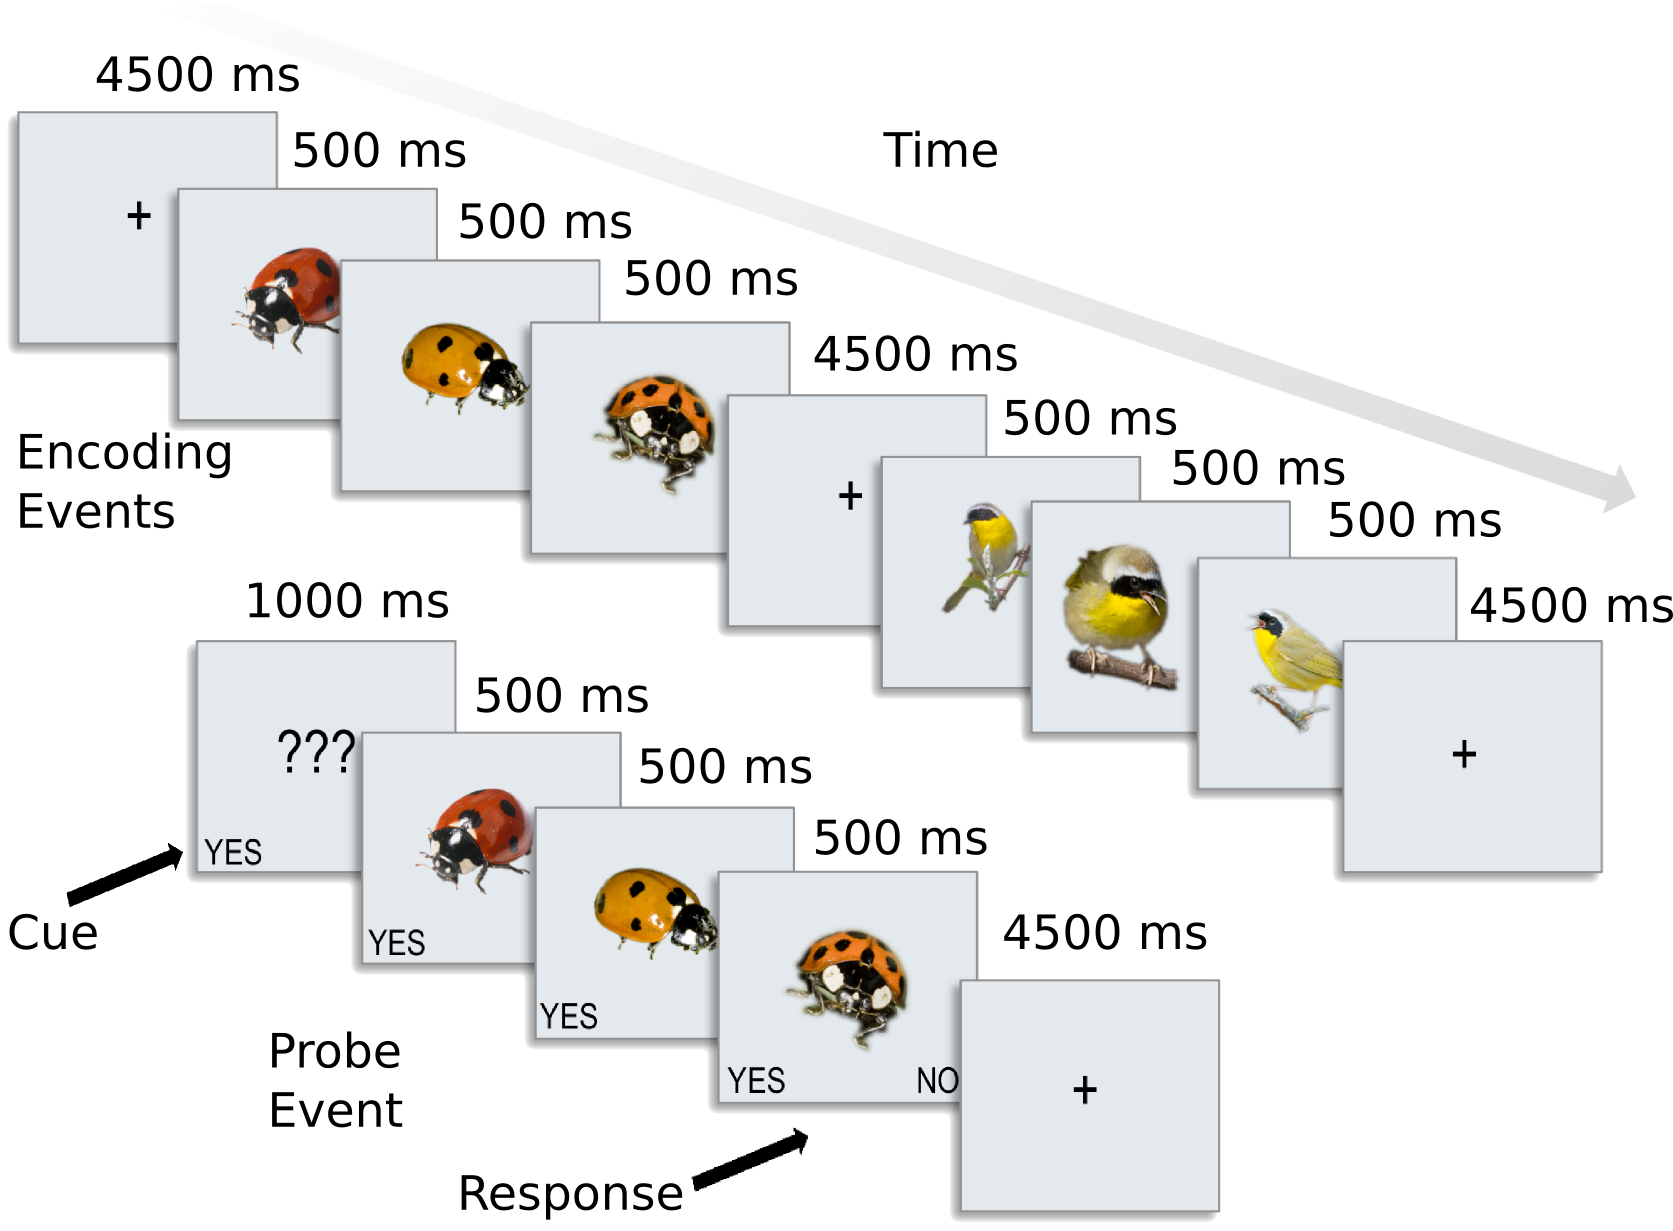
Part 1, 6 April – 2 May 2016: MVPA for fMRI and MEEG data using CoSMoMVPA, taught by Nikolaas Oosterhof and James Haxby. Part 2, between 4 May and 11 May 2016: analysis of MEG data using FieldTrip, taught by Christoph Braun.
Prerequisites
Matlab / Octave Advanced beginner level.
fMRI analysis advanced beginner level.
Goals of the fMRI / MVPA part of the course
For fMRI data, describe the typical MVPA approaches (correlation analysis, classification analysis, representational similarity analysis) applied to both regions of interest and across the whole brain in a searchlight approach.
For MEEG data, learn basic spatio-temporal MVPA approaches.
If necessary, learn enough Matlab to use CoSMoMVPA.
- Learn how to use CoSMoMVPA to perform these analyses:
Understand the dataset structure to represent both the data itself (e.g. raw measurements or summary statistics) and its attributes (e.g. labels of conditions (targets), data acquisition run (chunks).
See how parts of the data can be selected using slicing and splitting, and combined using stacking.
Introduce measures that compute summaries of the data (such as correlation differences, classification accuracies, similarity to an a prior defined representational similarity matrix) that can be applied to both a single ROI or in a searchlight.
Make yourself an independent user, so that you can apply the techniques learnt here to your own datasets.
Not covered in this course
Preprocessing of fMRI or MEEG data
Advanced topics in Matlab / GNU Octave
Connectivity analysis
How to become a CoSMoMVPA developer
Sample Datasets
AK6 dataset
This dataset is used for exercises shown on the website (with answers), and you can use it to learn MVPA. It contains preprocessed data for 8 subjects from [CGG+12]. In this experiment, participants were presented with categories of six animals: 2 primates: monkeys and lemurs; 2 birds: mallard ducks and yellow-throated warblers; and 2 bugs: ladybugs and luna moths.
Download link: tutorial data: datadb-ak6-v0.3.zip.
For each participant, the following data is present in the ak6 (for Animal Kingdom, 6 species) directory:
- s0[1-8]/                  This directory contains fMRI data from 8 of the 12
                            participants studied in the experiment reported in
                            Connolly et al. 2012 (Code-named 'AK6' for animal
                            kingdom, 6-species). Each subject's subdirectory
                            contains the following data:
   - glm_T_stats_perrun.nii A 60-volume file of EPI-data preprocessed using
                            AFNI up to and including fitting a general linear
                            model using 3dDeconvolve. Each volume contains the
                            t-statistics for the estimated response to a one
                            of the 6 stimulus categories. These estimates were
                            calculated independently for each of the 10 runs
                            in the experiment.
   - glm_T_stats_even.nii   Data derived from glm_T_stats_perrun.nii.
   - glm_T_stats_odd.nii    Each is a 6-volume file with the T-values averaged
                            across even and odd runs for each category.
   - brain.nii              Skull-stripped T1-weighted anatomical brain image.
   - brain_mask.nii         Whole-brain mask in EPI-space/resolution.
   - vt_mask.nii            Bilateral ventral temporal cortex mask similar to
                            that used in Connolly et al. 2012.
   - ev_mask.nii            Bilateral early visual cortex mask.
Also present are model similarity structures, which you can see here:
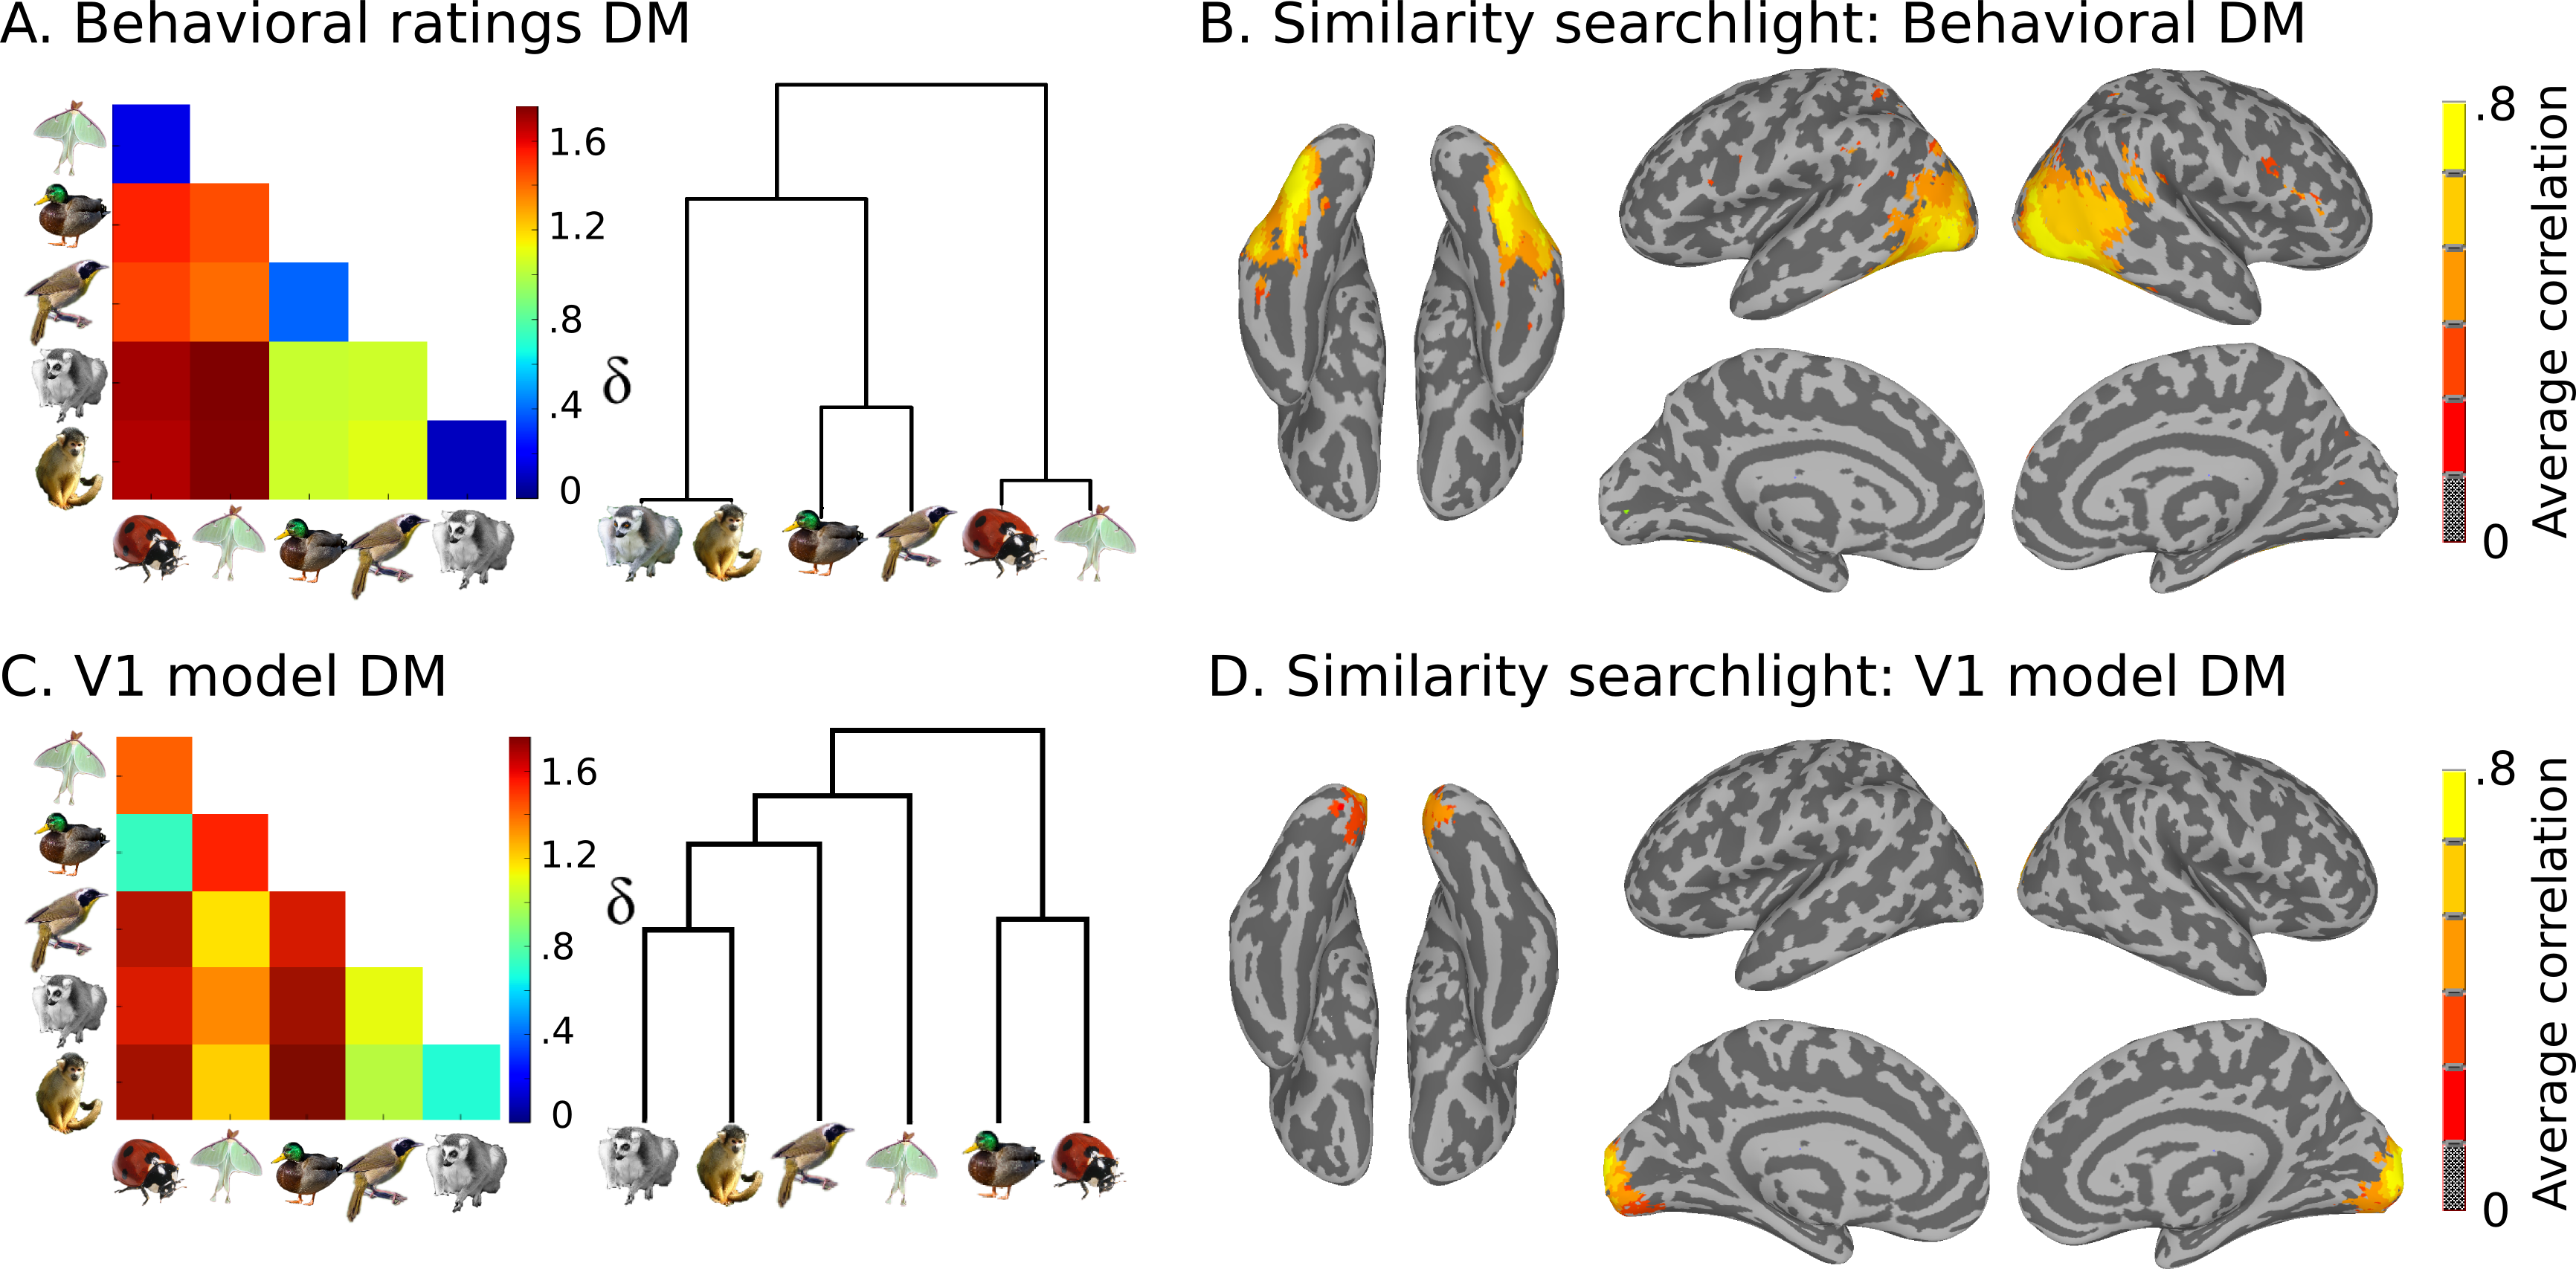
This data is stored in the models directory:
- models
   - behav_sim.mat          Matlab file with behavioural similarity ratings.
   - v1_model.mat           Matlab file with similarity values based on
                            low-level visual properties of the stimuli.
Haxby2001 dataset
This dataset is used for assignments which will count towards the student’s grade for the course.
It contains data from five participants in the original study by Haxby et al ([HGF+01]); for details see the README file.
Download link: Haxby 2001 et al data GLM data.
MEG obj6 dataset
This dataset is used for both the tutorial and for the assignments.
It contains MEG data from a single participant viewing images of six categories; for details see the README file.
Download link: tutorial data with MEEG obj6 data only :datadb:-meg_obj6-`.
MEG TAC dataset with anatomical scan
This dataset contains the files sub24_block02_TAC.fif and 02_MPRAGE_GRAPPA3_900.zip. Contact Christoph Braun (see below for contact information) to obtain this data.
It was created in an experiment in which sham (event 1), near-threshold (event 3), and supra-threshold tactile stimuli (event 5) were presented. Depending on whether stimuli were detected or not detected or whether there was no response the following response events were created. The trigger information is coded in channel STI101.
Stimulus condition |
Event |
Response Events |
||
|---|---|---|---|---|
Not detected |
Detected |
No response |
||
Sham |
1 |
12 |
14 |
16 |
Near Threshold |
3 |
32 |
34 |
36 |
Supra Threshold |
5 |
52 |
54 |
56 |
Links
Official website: http://cosmomvpa.org. This is the up-to-date authoritative source.
Internal backup mirror (CIMeC-only): http://mat-storage-weisz.unitn.it/cosmomvpa/. This website may be out of date, but can be used for downloading example data.
Part 2, MEG slides:
More information about MEG analysis: FieldTrip tutorial.
Assignments
In the first part (MVPA for fMRI and MEEG using CoSMoMVPA; before May 3), we plan one assignment per week; each assignment will involve MVPA using CoSMoMVPA. In the second part (MEEG analysis using FieldTrip; after May 3) there will be three assignments. At least two assignments have to be completed to pass the second part, but to get a higher (maximal) grade all three assignments must be completed.
Notes:
You can use PyMVPA for all fMRI MVPA exercises (instead of CoSMoMVPA), but you will be more or less on your own; PyMVPA is not part of the course.
Using PyMVPA for the MEEG exercises is currently rather challenging, as there is little support for MEEG in PyMVPA.
Preparation
Download the Haxby2001 GLM dataset and store it at a location of your preference.
Download the MEG obj6 dataset and add it to the location of the tutorial data.
Update your
.cosmomvpa.cfgfile, so that it contains a new line with ahaxby2001_data_pathkey; for example the contents could be as follows:tutorial_data_path=/Users/karen/datasets/CoSMoMVPA/datadb/tutorial_data output_data_path=/Users/karen/tmp/CoSMoMVPA_output haxby2001_data_path=/Users/karen/datasets/CoSMoMVPA/haxby2001-glm-v0.1
Format
Please write a matlab .m file that can be executed. Use the following as a template for the beginning of the file:
% CIMEC 2016 hands-on method class
% Assignment 1
%
% Name:           karen
% Student number: 654321
% Email address:  karen@studenti.unitn.it
% Date:           08 Apr 2016
%
% I, karen, declare that the work included is my own work; that I did not
% copy from others (unless I indicated otherwise); that I did not
% let others copy my work; and that the source of any code obtained
% from elsewhere is properly attributed / cited.

config=cosmo_config();
data_path=config.haxby2001_data_path;
with the name (karen) and other information replaced by your details. Please make sure that your solution can be run on other computers where the data is stored in a different directory. Note that you must only include the declaration (the paragraph starting with “I […] declare that the work assignment are my own work;”) if this statement is true.
Assignments must be your own work
Your solution will be rated not only on correctness and completeness of the implementation, but also on readability and understandibility. Please indent your code, add comments where necessary, and use reasonable variable names. For details, see Matlab code guidelines. You can include images or screenshots if that is asked in the exercise.
We attempt to assign interesting programs that will help you learn the topics discussed in the course, and grade the assignments quickly and fairly. If you need more clarification or help, please let us know - we will try to help. If you are unable to meet a deadline and need more time, please contact us and, most likely, an extension can probably be arranged if the cause for the delay seems reasonable.
You should write your own code and comments. It is acceptable to use code from the CoSMoMVPA website, the CoSMoMVPA code-base, or from other internet sources, but if you do so, indicate (through comments in the code) where you have used (segments of) code from elsewhere. It is also acceptable to discuss the problem and algorithm with others; if you do so, indicate for which parts this is the case (through comments in the code). You can help debug other people’s code, or compare the output (the result of running the code), as long as this does not involve copying code from yourself or third parties. It is not acceptable to collaborate on writing code together, to copy parts of the implementation (code) from others, or make available your code to other participants in the course. Neither plagiarism nor the faclitation of plagariarism (by letting others copy your work) is acceptable. If non-acceptable behaviour is detected, this may result in serious consequences including but not limited to a reduced grade, failing the class, notification of the program director, and/or expulsion from your program. If you have any questions, please let us know.
Please send your solution before the deadline to James Haxby and Nikolaas Oosterhof (MVPA part), and Christoph Braun (MEG part) and use the subject line CIMEC hands-on - exercise X, with X the appropriate value.
Exercise 1 - deadline 23:59, 19 April 2016
Use the Haxby 2001 GLM dataset (see above) for the following analyses:
single subject pattern similarity visualization. Load GLM data from subject
s01from two thirds of the data,glm_t1_8cond-tstat.niiandglm_t2_8cond-tstat.nii. Use thevtmask and load the data for eight conditions from these two halves. Now compute all8 * 8 = 64pair-wise correlations of the patterns across the first and second half. Quantify the presence of reliable patterns through a split-half information score that discriminates between conditiosn by computing the average on-diagonal values minus the average of the off-diagonal values in the correlation matrix. Visualize the correlations usingimagesc. (Note: since the single subject results are not very strong, do not worry if the matrix does not show clearly higher values on the diagonal than off the diagonal)Suggested functions:
corr/ cosmo corr (or cosmo correlation measure)meanimagesc
single subject significance testing. Using the data loaded for subject
s01as described above, estimate how significant the split-half correlation score is different from zero. Generate a null dataset by reshuffling the labels in one half of the data, and then compute the split-half correlation score for this null dataset. Using afor-loop, repeat this process 1000 times (i.e., use 1000 iterations) to get 1000 split-half null data correlation scores. Finally, compute the significance of the original split-half correlation score by dividing the number of times the original split-half correlation score is less than the null-data correlation scores by the number of iterations (1000). Show a histogram with the 1000 null data correlation scores, and a vertical line showing the correlation score in the original data.Suggested functions:
randperm(or cosmo randomize targets)hist
group analysis. Load the same data as in the single subject analysis, but now for each of the five participants. Do a group analysis in areas
vtandevusing a one-sample t-test to estimate how reliable the split-half correlation score is different from zero across the five participants.Suggested functions:
ttest(or cosmo stat)
Exercise 2 - deadline 23:59, 26 April 2016
Use the Haxby 2001 GLM dataset (see above) for the following analyses:
Single subject pattern classification. Load data from each run for each of the eight conditions
glm_t12-perrun_8cond-tstat.nii. Using take-one-run-out cross-validation, use both the LDA and NN classifier to compute classificationa accuracies in thevtregion. Do the same for theevregion. Compute classification accuracies and show classification confusion matrices for each of the two ROIs and each of the classifiers.Suggested functions:
(Optional) cosmo confusion matrix.
(Optional) cosmo crossvalidation measure.
(Optional) cosmo nfold partitioner.
imagesc.
Custom classifier. Implement a maximum correlation classifier (c.f. [HGF+01]). Given a test pattern, the maximum correlation classifier should return the class corresponding to the train patterns that has the highest (Pearson) correlation with the test pattern. Then use it to classify patterns of the eight categories using the
glm_t12-perrun_8cond-tstat.niidata in thevtregion. Your solution should start as follows:function pred=my_corr_classify(samples_train,targets_train,samples_test,opt) % maximum correlation classifier % % predicted=my_max_corr_classify(samples_train, targets_train, samples_test[,opt]) % % Inputs: % samples_train PxR training data for P samples and R features % targets_train Px1 training data classes % samples_test QxR test data % opt Optional struct, unused. % % Output: % predicted Qx1 predicted data classes for samples_test. For % all values of k in the range (1:Q): % if r is the row for which tr_samples(r,:) shows % the highest with samples_train(k,:), then % pred(k)==targets_train(r) % [nsamples_train, nfeatures]=size(samples_train); [ntargets, one_check]=size(targets_train); [nsamples_test, nfeatures_check]=size(te_samples); if nsamples_train~=ntargets error('Samples (%d) and targets (%d) size mismatch',... nsamples_train, ntargets); end if one_check~=1 error('targets must be a column vector'); end if nfeatures~=nfeatures_check error('feature count mismatch in train (%d) and test (%d) set',... nfeatures, nfeatures_check); end %%%% Your code comes here %%%%
Suggested functions:
corr(or cosmo corr)
Group analysis. Load the same data as in the single subject analysis, but now for each of the five participants. Using the LDA classifier, do a group analysis in areas
vtandevusing a one-sample t-test to estimate how reliable classification accuracies are different from chance level (1/8) across the five participants.Suggested functions:
ttest(or cosmo stat)
Exercise 3 - deadline 23:59, 03 May 2016
update 30 April 2016: in version 0.1 of the dataset, ``common/brain_mask.nii`` had the value 1 for all voxels. The dataset has been updated to version 0.2. The mask is also available as a separate `nifti mask file <haxby2001-mask_brain.nii>`_
Use the Haxby 2001 GLM dataset (see above) for the following analyses:
Classification searchlight. Use an LDA classifier with take-one-out crossvalidation to classify the 8 conditions for participant
s01. Use the common brain mask incommon/mask_brain.niiand the data froms01/glm_t12-perrun_8cond-tstat.nii; for the searchlight, use a spherical neighborhood with approximately 100 voxels in each searchlight. Show a map with classification accuracies using cosmo plot slices.Suggested functions:
RSA target similarity searchlight measure. Use the behavioural similarity ratings from
models/haxby2001_behav.matand the data inglm_t12-average_8cond-tstat.niifrom participants01. Then run a searchlight to localize regions in the brain where the neural similarity is similar to the behavioural similarity ratings. Show a map with representational similarities using cosmo plot slices.Suggested functions:
RSA between-participant reliabillity searchlight. Using data from participants s01 and s02, load the
glm_t12-average_8cond-tstat.niidata from each of the two participants. Then run two searchlights (one for each participant) with about 100 voxels per searchlight: use the cosmo dissimilarity matrix measure to store the vector form (a vector with the elements of the lower diagonal) of dissimilarity matrices at each voxel location. . Then use aforloop over the features (voxels) to compute, for each voxel (i.e. feature, searchlight location), the correlation between the vector form between the two participants. Show a map using cosmo plot slices. (Note: it is not uncommon for this exercise to take 10 minutes, or even longer, to run on a standard PC).Suggested functions:
Exercise 4 - deadline 23:59, 17 May 2016
Use the MEG object 6 dataset (see Download instructions) to show an animation of the classification confusion matrices over time. Load the
meg_obj6_s00.matfile, then select data from all trials from the following sensors:sensors={'MEG1632', 'MEG1642', 'MEG1732', 'MEG1842', ... 'MEG1912', 'MEG1922', 'MEG1942', 'MEG2232', ... 'MEG2312', 'MEG2322', 'MEG2342', 'MEG2432', ... 'MEG2442', 'MEG2512', 'MEG2532',... 'MEG1633', 'MEG1643', 'MEG1733', 'MEG1843', ... 'MEG1913', 'MEG1923', 'MEG1943', 'MEG2233', ... 'MEG2313', 'MEG2323', 'MEG2343', 'MEG2433', ... 'MEG2443', 'MEG2513', 'MEG2533'};
Re-assign chunks into two values, with approximately an equal amount of trials in each chunk. Define a time neighborhood for each time point with a radius of two time points. Use an odd-even partitioning scheme. Then, for each element (time point) in the neighborhood, use the LDA classifier to compute predictions for each test sample in the balanced partitioning scheme (you can use either a
for-loop, or the cosmo searchlight function for this). Using aforloop, show the confusion matrices (usedrawnowto draw a new frame) to see an animation of classification confusion matrices over time. How would you interpret this animation?Suggested functions:
Use the Haxby 2001 GLM dataset (see above) to run a Naive Bayes classifier with a searchlight analysis with 100 voxels per searchlight, on all 5 subjects using their
glm_t12-perrun_8cond-tstat.niifiles. Use the common mask found in thecommondirectory, and for faster execution, use the fast Naive Bayes searchlight and odd-even partitioning scheme. Assign targets and chunks for a second level analysis, then compute two maps. The first is an t-test map against the null hypothesis of chance classification (1/8), using cosmo stat (subtract chance level fromsamplesfirst). The second is a Threshold-Free Cluster Enhancement z-score map, corrected for multiple comparisons, using cosmo montecarlo cluster stat (make sure to set theh0_meanoption appropriately, and use500iterations). Visualize both maps. Briefly explain how you would interpret the two maps.Suggested functions:
MEG Exercises - deadline 23:59, 15 June 2016
Please send your solutions to Christoph Braun
You are asked to complete at least two of the three assignments below to pass the class; for a higher (and maximal) grade you will have to complete all three exercises.
Hand in your commented code and the results of your analysis. Comment on and interpret your results. Present figures in your report and mention possible difficulties in your report.
Time-lock analysis
Use the dataset in
sub24_block02_TAC.fiffor the following analysis:Define trials with a prestimulus interval and a poststimulus interval of 2 s each.
Lowpass filter the raw data with a cut-off frequency of 40 Hz.
Reject trials and/or channels that show artifacts (use ft_rejectvisual). Comment what you see and how you decided to remove trials/channels. Although magnetometers show higher magnetic activity than gradiometers the amplitudes are lower because the magnetic flux is divided by the distance of the two gradiometer coils. Therefore gradiometer values are 25 times higher than magnetometer values. Using ft_visualreject, set cfg.magscale to 25.
Do the time-locked analysis with respect to stimulus presentation for all the different conditions. Plot the evoked responses summarized across all channels for the different conditions. In particular, plot the different stimulation conditions in different subplots. In each subplot, the evoked responses for detected and not-detected stimuli.
Plot the topography at different peak latencies. For the different stimuli
Time-frequency analysis
Use the dataset in
sub24_block02_TAC.fiffor the following analysis:Define trials with a prestimulus interval and a poststimulus interval of 2 s each.
Lowpass filter the raw data with a cutoff frequency at 40 Hz.
Reject trials and/or channels that show artifacts (use ft_rejectvisual). Comment what you see and how you decided to remove trials/channels.
Although magnetometers show higher magnetic activity than gradiometers the amplitudes are lower because the magnetic flux is divided by the distance of the two gradiometer coils. Therefore gradiometer values are 25 times higher than magnetometer values. Using ft_visualreject, set cfg.magscale to 25.
Perform two different analyses: first a time-frequency analysis and then a spectral analysis. Focus on the baseline period.
Compare detected stimuli versus not-detected stimuli. Since the number of trials is critical for the power make sure that you analyze the same number of trials for both conditions.
Source analysis
The zip file
02_MPRAGE_GRAPPA3_900.zipcontains an anatomical MRI of a subject. Use this together with the dataset insub24_block02_TAC.fiffor the following analysis:Load the MRI file and coregister the anatomy to the functional data (either to the timelock-analysis or the timefrequency analysis).
Create a headmodel and a sourcemodel (rectangular equally spaced grid)
Localize either a condition of the timefrequency analysis or the timelock analysis.
Display results overlaid on to the subject’s head.
Extra task in case you want to do a more challenging task
Load the MRI file and coregister the anatomy to the functional data (either to the timelock-analysis or the timefrequency analysis).
Create a head model for the subject’s MRI
Create a equidistant, rectangular sourcemodel in the MNI-template brain (provided by fieldtrip)
Warp the template sourcemodel grid to the individual subject’s head.
Do the sourcelocalization either oft he timefrequency analysis or the timelock analysis.
Display results on the template brain.
FAQ
For the assignments, can I use / adapt existing CoSMoMVPA code from the exercises or demonstrations?
yes, as long as you indicate that you copied the code from elsewhere, and indicate where you copied it from.
Are there slides available?
For part 1 (MVPA) we try to provide all necessary information on the website.
For part 2 (MEG), see the links section.
For assignment 2, I have a sort of “conceptual” doubt with part 2: is the custom classifier supposed to work on a 8x8 correlation matrix?
No, the classifier is supposed to correlate every pattern in the training set with every pattern in the test set. Your function should support both training sets and test with multiple samples (rows in
samples_trainandsamples_test).
For assignment 3, all values in the common mask are 1. Is my file corrupt?
No, an earlier version of the dataset contained the wrong mask (sorry for that). In version 0.2 (30 April 2016), this has been corrected. As indicated above, the new mask can also be downloaded separately.
From the Haxby2001 glm dataset, when computing the average for each category in the
glm_t12-perrun_8cond-tstat.niifile, I get different numbers than the values inglm_t12-average_8cond-tstat.nii. How is this possible?The
glm_t12-perrun_8cond-tstat.niiandglm_t12-average_8cond-tstat.niiboth contain t-test statistics. The t-test statistics are however based on different residuals. In theperrunfile, residuals are based on each run separately; in theaveragefile, residuals are based on all eight runs combined.
In assignment 3, last part (between-subject reliability), I have an array with two elements, each a dataset corresponding to a subject:
all_dsm =

    [1x1 struct]    [1x1 struct]
Then, I compute my correlation for each voxel across these 2 subjects and store the result in a 1 x num_of_voxels array (‘corr’). To plot these results, I copy one of the two ds I worked on, and I substitute the .samples with my ‘corr’ array:
ds_corr = ds_dsm;
ds_corr.samples = corr;

cosmo_plot_slices(ds_corr);
If i do just this, the error is the following:
Error using cosmo_plot_slices (line 72)
expected 3D image - did you select a single volume?
But if I transpose the targets in my ds_corr, everything works… or at least the image appears and to my ‘naive’ eye seems correct.
I’m sure I just miss something in the logics of cosmo_plot_slices: could it be that having a 1 x n samples array, if I don’t transpose the targets into an horizontal vector the dimensions simply mismatch, then the code doesn’t work?
The issue is how you substitud the .samples in the ‘corr’ array.
ds_dsmhas 28 (=8*(8-1)/2) rows (samples), and the samples attributes each must have the same number of rows. One way to deal with this is to do:ds_corr = cosmo_slice(ds_dsm,1); ds_corr.samples = corr;
to select, in both
.samplesand each field in.sa, only the first row. The reason why transposing.sa.targetsworks is that it then becomes a1 x 28row vector, and the number of rows (=1) matches the number of rows in the correlation row vector.Also note that your use of
corras a variable is not recommended, as it is a builtin function in the matlab statistics toolbox. Using the same name for builtin functions and for variables may lead to confusion.
In assignment 4 (description 9 May 2016), last part (classification with Naive Bayes) I am confused about using
glm_t12-average_8cond-tstat.nii(averaged data). How can I used cross-validation using this data?Indeed the dataset instructed to use was not compatible with using a cross-validation experiment, which made it difficult if not impossible to do the assignment (sorry for that). Please use
glm_t12-perrun_8cond-tstat.nii(for each participant separately) instead; then run a searchlight with cross-validation for each subject separately. To support students with the confusing instructions, the deadline for this assignment has been extended for a week.
Schedule
Location: Pallazina Fedrigotti, computer room at the ground floor.
6 Apr - 2 May: taught by Nikolaas Oosterhof, James Haxby 4 Apr - 13 May: taught by Christoph Braun
Date |
Time |
Description |
|---|---|---|
We 6 Apr |
09:00-10:45 |
General intro: Get your computer ready to run CoSMoMVPA and use the tutorial dataset |
Th 7 Apr |
14:00-15:45 |
Practical exercises: Basic dataset operations |
Fr 8 Apr |
14:00-15:45 |
Practical exercises: Basic dataset operations, split-half correlation analysis |
We 13 Apr |
09:00-10:45 |
Practical exercises: Split-half correlation analysis |
Th 14 Apr |
14:00-15:45 |
Practical exercises: Split-half correlation analysis, single-fold classification |
Fr 15 Apr |
14:00-15:45 |
Practical exercises: Classification with cross-validation |
We 20 Apr |
09:00-10:45 |
Practical exercises: Measures, neighborhoods, searchlight |
Th 21 Apr |
14:00-15:45 |
Practical exercises: Basic RSA |
Fr 22 Apr |
14:00-15:45 |
Practical exercises: Basic RSA, searchlight RSA |
Tu 26 Apr |
14:00-15:45 |
Practical exercises: searchlight RSA, MEEG basics, classification |
We 27 Apr |
09:00-10:45 |
Practical exercises: MEEG searchlight, MEEG time generalization |
Mo 2 May |
14:00-15:45 |
Practical exercises: MEEG time generalization, multiple comparison correction; Concluding remarks |
We 4 May |
09:00-10:45 |
Trigger, Segmentation, Filtering |
Th 5 May |
14:00-15:45 |
Artifact rejection, Time locked analysis |
Fr 6 May |
14:00-15:45 |
Time frequency analysis |
We 11 May |
09:00-10:45 |
Functional connectivity |
Th 12 May |
14:00-15:45 |
Preparation of source localization |
Fr 13 May |
14:00-15:45 |
Source localization, review |
Contact
Please send an email to a@d, b@d, or c@e, a=nikolaas.oosterhof, b=james.haxby, c=christoph.braun, d=unitn.it, e=uni-tuebingen.de.