Introduction
Prerequisites
Matlab / Octave Advanced beginner level.
fMRI analysis advanced beginner level.
Goals of this course
For fMRI data, describe the typical MVPA approaches (correlation analysis, classification analysis, representational similarity analysis) applied to both regions of interest and across the whole brain in a searchlight approach.
- Learn how to use CoSMoMVPA to perform these analyses:
Understand the dataset structure to represent both the data itself (e.g. raw measurements or summary statistics) and its attributes (e.g. labels of conditions (targets), data acquisition run (chunks).
See how parts of the data can be selected using slicing and splitting, and combined using stacking.
Introduce measures that compute summaries of the data (such as correlation differences, classification accuracies, similarity to an a prior defined representational similarity matrix) that can be applied to both a single ROI or in a searchlight.
Make yourself an independent user, so that you can apply the techniques learnt here to your own datasets.
Not covered in this course
Preprocessing of fMRI data
Learning to use Matlab / Octave
Other dataset types than volumetric fMRI data (MEEG, surface-based fMRI)
How to become a CoSMoMVPA developer
Sample Dataset
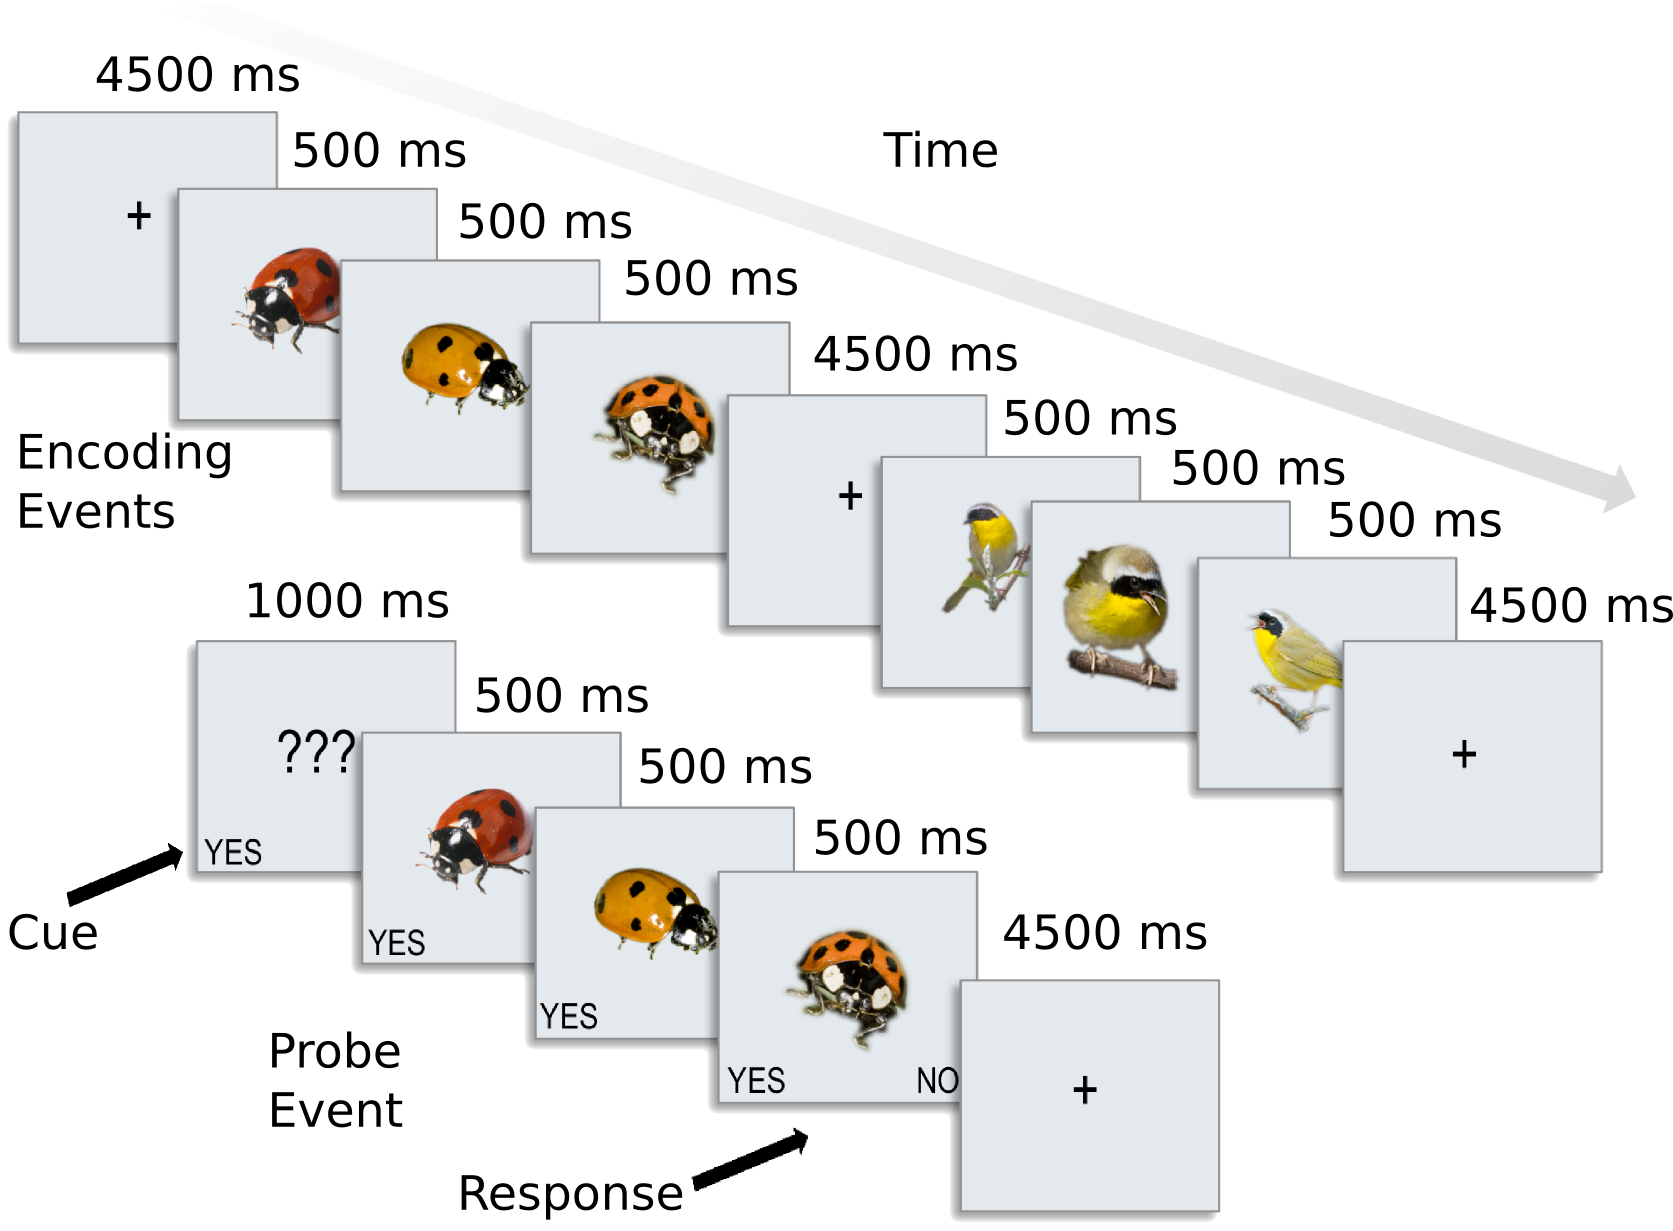
The dataset used here contains preprocessed data for 8 subjects from [CGG+12]. In this experiment, participants were presented with categories of six animals: 2 primates: monkeys and lemurs; 2 birds: mallard ducks and yellow-throated warblers; and 2 bugs: ladybugs and luna moths.
For each participant, the following data is present in the ak6 (for Animal Kingdom, 6 species) directory:
- s0[1-8]/                  This directory contains fMRI data from 8 of the 12
                            participants studied in the experiment reported in
                            Connolly et al. 2012 (Code-named 'AK6' for animal
                            kingdom, 6-species). Each subject's subdirectory
                            contains the following data:
   - glm_T_stats_perrun.nii A 60-volume file of EPI-data preprocessed using
                            AFNI up to and including fitting a general linear
                            model using 3dDeconvolve. Each volume contains the
                            t-statistics for the estimated response to a one
                            of the 6 stimulus categories. These estimates were
                            calculated independently for each of the 10 runs
                            in the experiment.
   - glm_T_stats_even.nii   Data derived from glm_T_stats_perrun.nii.
   - glm_T_stats_odd.nii    Each is a 6-volume file with the T-values averaged
                            across even and odd runs for each category.
   - brain.nii              Skull-stripped T1-weighted anatomical brain image.
   - brain_mask.nii         Whole-brain mask in EPI-space/resolution.
   - vt_mask.nii            Bilateral ventral temporal cortex mask similar to
                            that used in Connolly et al. 2012.
   - ev_mask.nii            Bilateral early visual cortex mask.
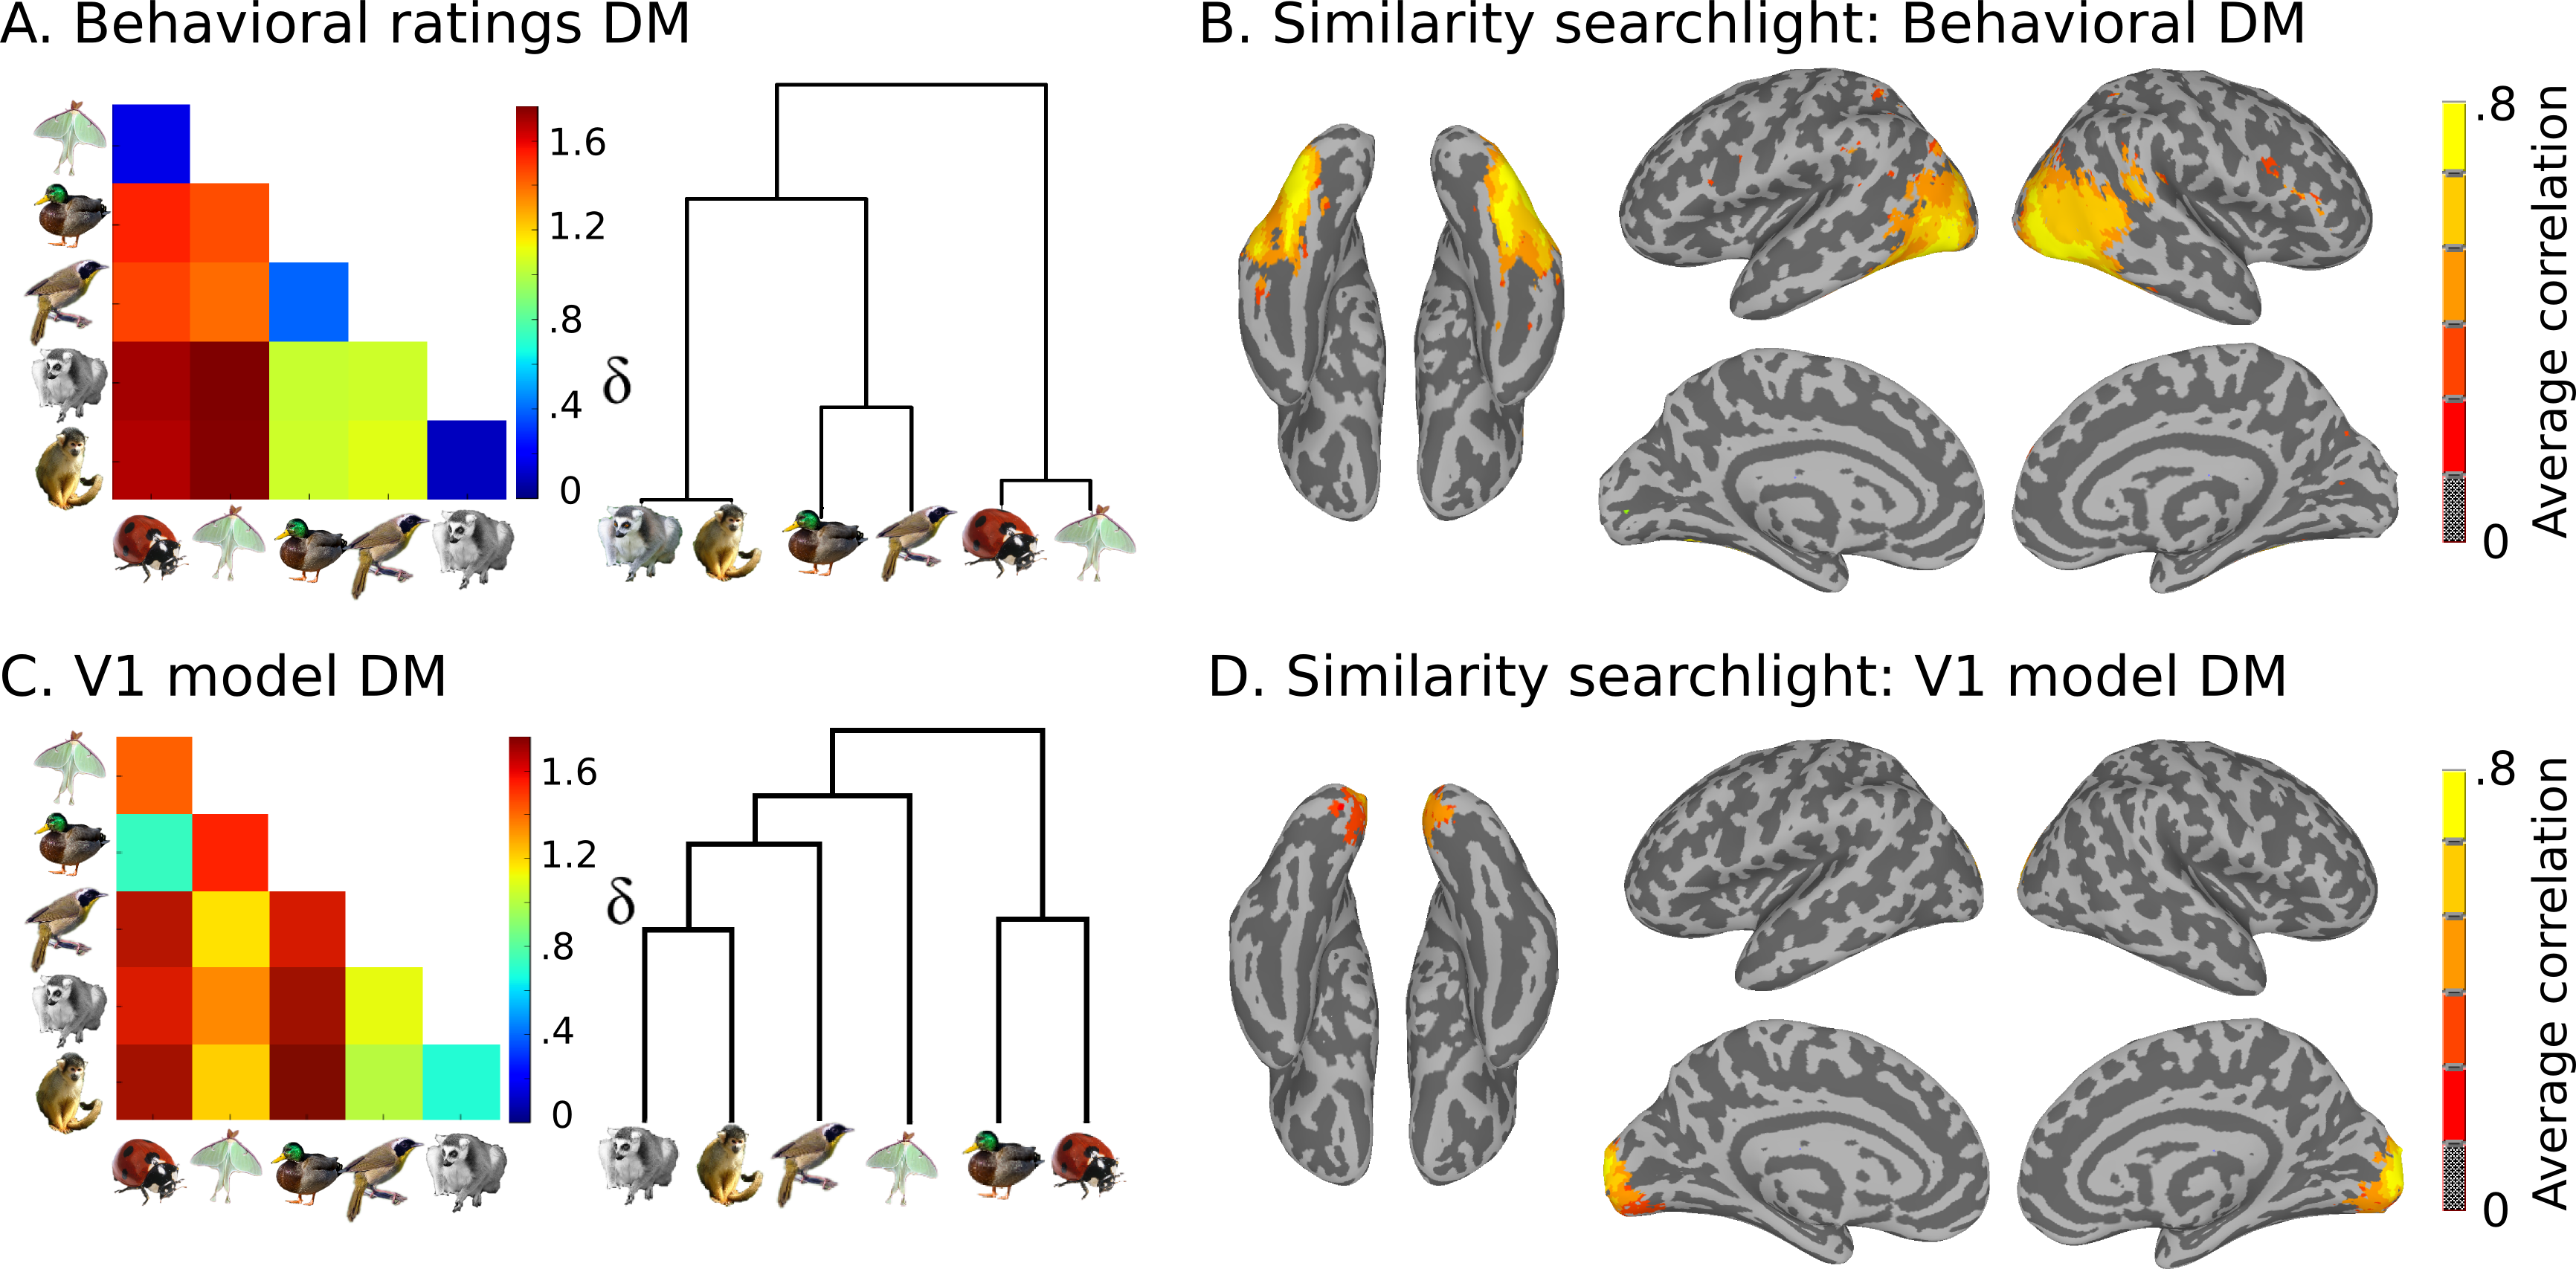
Also present are model similarity structures, which you can see here:
This data is stored in the models directory:
- models
   - behav_sim.mat          Matlab file with behavioural similarity ratings.
   - v1_model.mat           Matlab file with similarity values based on
                            low-level visual properties of the stimuli.
To cover in this workshop
CoSMoMVPA concepts and dataset structure.
Basic operations on datasets.
Introduction to common MVPA measures:
correlation difference
classification accuracy
representational similarity matching
Common MVPA techniques:
ROI analysis
Searchlight analysis
Tentative schedule
The following schedule is tentative and can change any moment depending on user, organizer and/or presenter needs.
Date and time |
Description |
|---|---|
We 10:00-12:00 |
General intro: Get your computer ready to run CoSMoMVPA and use the tutorial dataset |
We 12:00-14:00 |
Lunch break |
We 14:00-17:00 |
Practical exercises: Basic dataset operations |
Th 10:00-13:00 |
Practical exercises: Correlation analysis, basic classification analysis |
Th 13:00-14:00 |
Lunch break |
Th 14:00-17:00 |
Practical exercises: Classification with cross-validation, measures, neighborhoods |
Th 18:00-??:00 |
Social dinner at Hugo’s bar and grill, 72 High Street, Egham |
Fr 10:00-13:00 |
Practical exercises: Searchlight, RSA visualization and ROI analysis |
Fr 13:00-14:00 |
Lunch break |
Fr 14:00-17:00 |
RSA ROI and searchlight, multiple comparison correction, analysis decisions, concluding remarks |